
How to Measure AI Coding Productivity Without Vanity Metrics
Usage dashboards say people use AI. They don't say anything shipped. The delivery, quality and cost metrics that show real AI coding productivity.
October 6, 2026 · 7 min read

To measure Claude Code impact, track three layers together: how much the tool is used and what it costs, whether more work actually ships, and whether quality holds. Claude Code's built-in telemetry covers the first layer. The other two come from your Git host, CI/CD pipeline and incident records, measured against a baseline taken before rollout. Counting lines of code on its own will mislead you.
Why lines of code is the wrong measure
The clearest evidence comes from "Writing Code vs. Shipping Code", an NBER working paper by Demirer, Musolff and Yang (May 2026, revised September 2026) that studied more than 500,000 GitHub developers. For developers using synchronous coding agents, it found lines of code rose 958% and pull requests 86%, but releases rose only 20%. The gains shrink at each step from writing code to shipping it.
Google's 2025 DORA report points the same way: AI adoption has a positive relationship with delivery throughput but a negative one with delivery stability. And self-reports aren't a substitute. In METR's 2025 study, experienced developers took 19% longer with AI tools while believing they'd been 20% faster.

What Claude Code measures for you
Claude Code exports OpenTelemetry metrics and events. According to Anthropic's monitoring documentation, the metrics include:
| Metric | What it counts |
|---|---|
claude_code.session.count | Sessions started |
claude_code.lines_of_code.count | Lines of code modified |
claude_code.pull_request.count | Pull requests created |
claude_code.commit.count | Git commits created |
claude_code.cost.usage | Session cost in USD |
claude_code.token.usage | Tokens used |
claude_code.code_edit_tool.decision | Accept or reject decisions on code edits |
claude_code.active_time.total | Active time in seconds |
Telemetry is off until CLAUDE_CODE_ENABLE_TELEMETRY=1 is set, along with an exporter and endpoint. Administrators can set these for everyone through managed settings. Metrics can be broken down by user and organisation, and cost and token metrics by model.
These numbers are good for adoption and cost: who is using the tool, how often, and what it costs per engineer. Treat lines of code, commits and edit acceptance as activity measures. They tell you work is happening, not that it's shipping or that it's any good.

What to measure alongside it
Pair the telemetry with delivery and quality numbers you probably already collect:
- Pull request cycle time and review turnaround, from your Git host. If agents produce more code, review is often where it piles up.
- Deployment frequency and lead time for changes, from CI/CD. This is the "shipping" end of the NBER finding.
- Change failure rate and rework, from incidents and reverted or follow-up changes. This is the stability side DORA warns about.
- Escaped defects, from your issue tracker.
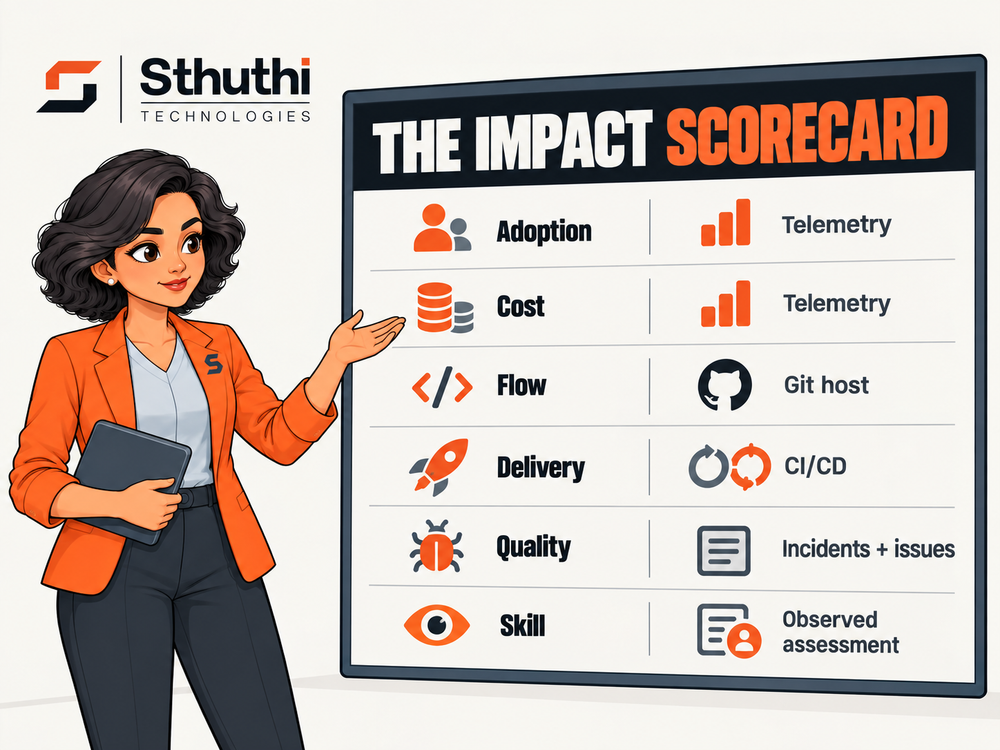
A simple Claude Code impact scorecard
| Layer | Measure | Source | Trap to avoid |
|---|---|---|---|
| Adoption | Active users, sessions per user | Claude Code telemetry | High usage isn't the same as value |
| Cost | Cost per active engineer per month | Claude Code telemetry | Cheap but unused, or costly but shipping: read it with delivery |
| Flow | Pull request cycle time, review turnaround | Git host | Faster reviews can mean lighter reviews |
| Delivery | Deployment frequency, lead time for changes | CI/CD | Compare against a baseline, not last week |
| Quality | Change failure rate, rework, escaped defects | Incidents, issue tracker | Quality problems show up weeks later |
| Skill | Who can direct and review agent work safely | An observed assessment | Self-ratings are unreliable |
Want this as a working spreadsheet? Download the free Claude Code impact scorecard (Excel). For a real example of a flow metric, The Payzon reported a 35% reduction in code review turnaround on its payment gateway microservices within 30 days of its first cohort. That's a client-reported figure, published with permission, and it's exactly the kind of number to check against your own baseline. Read the Payzon case study.
How to set up a fair comparison
- Take a baseline of the delivery and quality measures for several weeks before rollout.
- Compare like with like: the pilot team against its own baseline, or against a similar team, under the same release rules.
- Read results at 30, 60 and 90 days. Early numbers often include a learning dip.
- Look at cost per shipped change, not cost per line of code.
- Write down what else changed in the period, such as a reorganisation, a big launch or a new CI setup, so you don't credit the tool for it.

Measure skill separately from output
Delivery metrics tell you what happened across a team. They don't tell you which engineers can be trusted to direct an agent on a sensitive repository. That needs an observed check: someone scoping a real task, reviewing the agent's diff and explaining their decisions. That's the gap our Claude Code certification track fills, and it fits naturally into the checkpoint in our 90-day Claude Code rollout playbook.
For the review habits worth measuring, see the Claude Code review checklist, and for why usage dashboards aren't enough, read AI adoption vs. proficiency.

Sources: Demirer, Musolff and Yang, NBER Working Paper 35275; Claude Code monitoring usage; 2025 DORA report announcement; METR, July 2025. Checked 6 October 2026.
Frequently asked questions
What metrics does Claude Code export?
Claude Code exports OpenTelemetry metrics including session count, lines of code modified, pull requests and commits created, cost, token usage, code-edit accept or reject decisions and active time. Telemetry is enabled with CLAUDE_CODE_ENABLE_TELEMETRY=1.
Is lines of code a good measure of Claude Code productivity?
No. An NBER study of more than 500,000 GitHub developers found synchronous coding agents raised lines of code by 958% and pull requests by 86%, but releases by only 20%. Measure shipped changes, review time and change failures instead.
How long should we measure before judging impact?
Take a baseline for several weeks before rollout, then read results at 30, 60 and 90 days, comparing like with like under the same release rules.
Want your team's AI-tool usage actually checked?
See the published certification tracks, or tell us about the tool you're worried about.