
AI adoption vs. proficiency: why usage dashboards don't prove anyone can use the tool
88% of employees use AI tools, but real proficiency data tells a different story. Here's why adoption dashboards from Copilot and Viva can't measure whether anyone's actually good at the tool — and what can.
September 18, 2026 · 6 min read
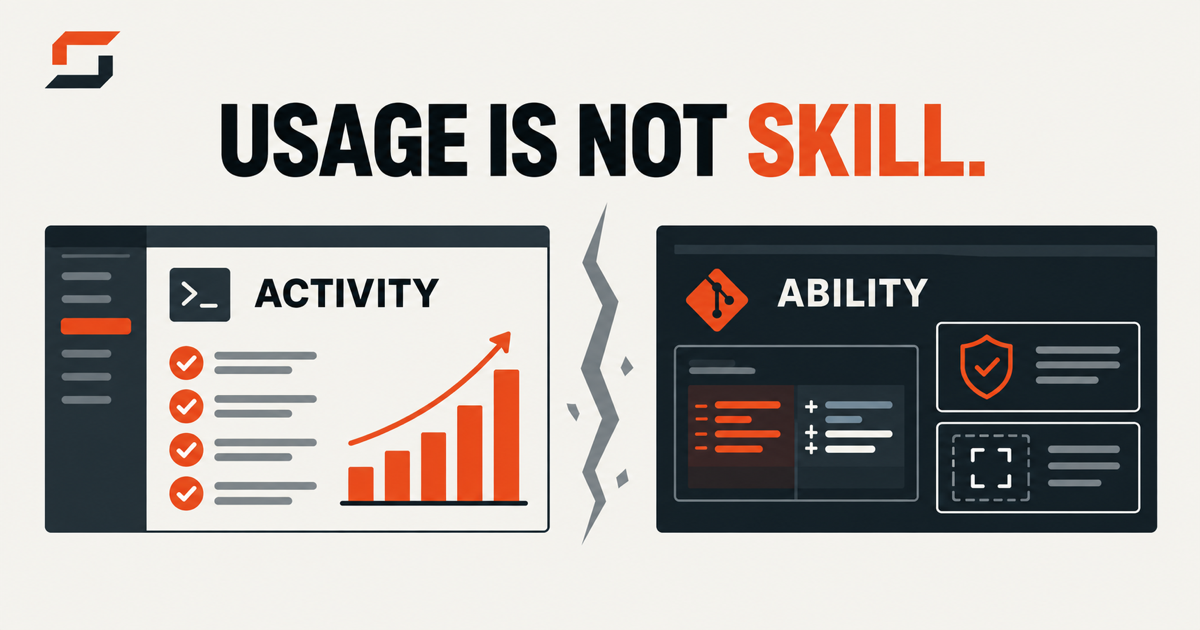
Adoption is not proficiency. A dashboard showing 88 percent of a company's employees "using AI" says nothing about whether any of them can use it well — and the gap between those two facts is where most of the return on an AI rollout quietly disappears. If your primary success metric for Claude Code, Copilot, or Gemini is a login count, a seat-utilization percentage, or a prompt-volume chart, you are measuring that the tool got switched on. You are not measuring whether anyone can actually use it.
What an adoption dashboard is built to count
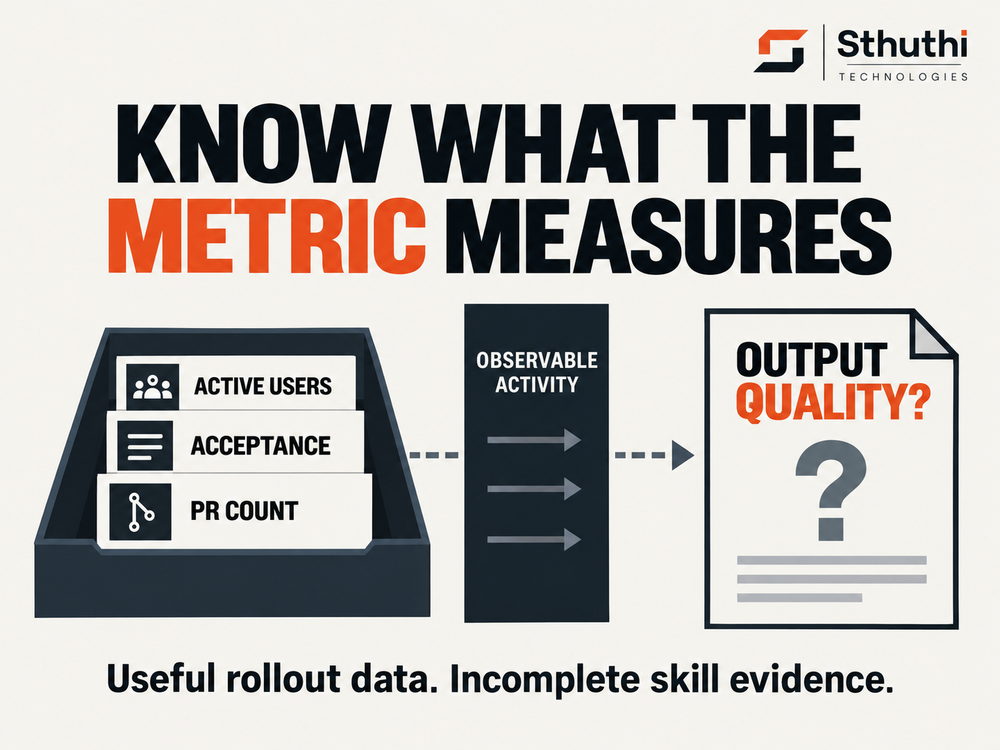
Look at what the market-leading adoption tools actually track. GitHub's own Copilot usage metrics documentation centers on daily and monthly active users, suggestion acceptance rate, lines of code suggested versus accepted, and pull request counts. In July 2026, GitHub shipped a new usage metrics impact dashboard that sorts users into adoption cohorts — Passive, then Phase 1 through 3 — based on a rolling 28-day window of product usage, and reports an "adoption multiplier" comparing PR throughput between engaged and passive users. It is a genuine improvement over a flat seat count. It is still entirely usage-based: it tells you how much code an engaged cohort ships, not whether that code is any good, or whether the engineer shipping it would catch a bad diff before it merged.
Microsoft's Viva Insights Copilot Dashboard runs the same way. It defines an "active Copilot user" as someone who performed one intentional AI action in a covered app, and in 2025 Microsoft added the ability to benchmark that adoption rate across managers, regions, and job functions — effectively a leaderboard for who's logging in, as one report on the feature put it. Neither of the two most widely deployed AI-usage dashboards on the market makes any claim to measure skill, judgment, or output quality. They were never built to. They were built to answer "is this thing turned on," which is a licensing and rollout question, not a competency question.
The gap between "using AI" and getting value from it is enormous
The clearest evidence that usage and value are different variables comes from OpenAI's own customer data. Its State of Enterprise AI 2025 report, built from usage patterns across more than a million business customers, found that "frontier workers" — the 95th percentile of adoption intensity — send six times as many messages as the median employee at the same company. For coding tasks specifically, that gap widens to 17 times. Everyone in the comparison had access to the same tool. Access wasn't the variable that mattered.
EY's 2025 Work Reimagined survey, covering 15,000 employees and 1,500 employers across 29 countries, found the same divide from the employee side: 88 percent of respondents said they use AI at work to some degree, but only 5 percent qualified as advanced users combining multiple tools into their workflow. Employees who'd received more than 81 hours of AI training reported an average productivity gain of 14 hours a week, against a median of 8 hours for everyone else. An adoption dashboard would show both groups as the same green checkmark: "using AI." The actual gap between them is a 75 percent difference in reported productivity gain.
95% of enterprise generative AI pilots deliver no measurable impact on profit and loss.MIT NANDA, "The GenAI Divide: State of AI in Business 2025"
That MIT finding, drawn from interviews with business leaders, employee surveys, and an analysis of hundreds of public AI deployments, is usually read as a story about bad tool selection or weak integration — Fortune's coverage frames it around "the GenAI divide" between the small number of deployments that stick and the majority that stall. It's also consistent with a simpler explanation: most of those pilots almost certainly reported healthy adoption numbers right up until the budget review that killed them. Usage was never the thing standing between them and P&L impact.
Even Deloitte's C-suite data points at the same wall
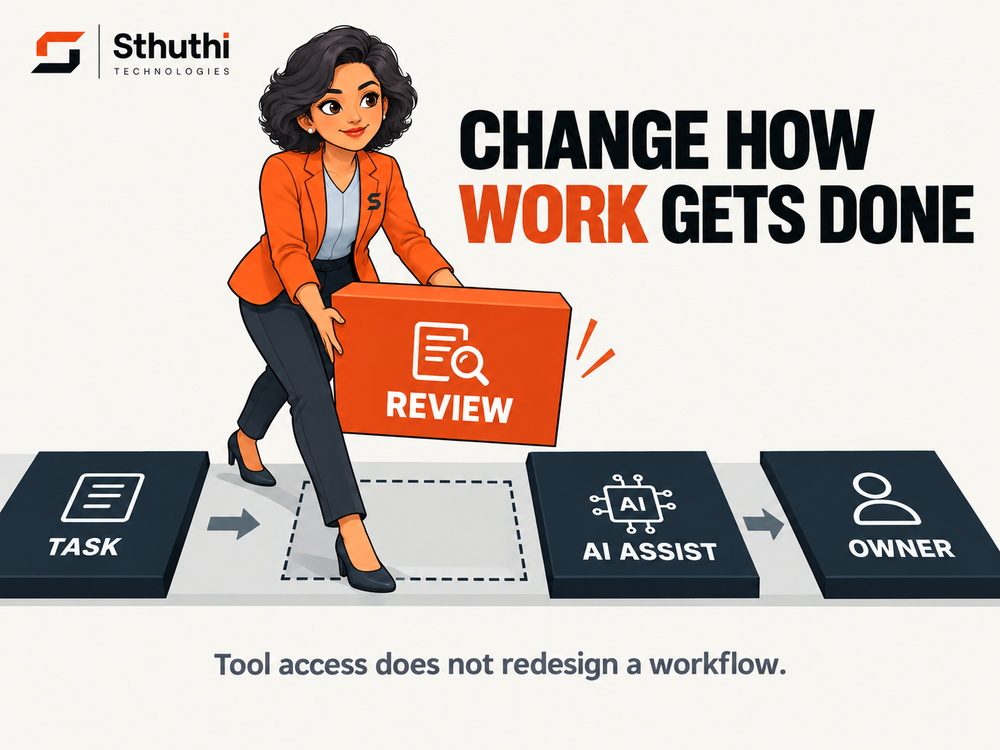
Deloitte's State of AI in the Enterprise 2026 report, based on more than 3,200 director-to-C-suite leaders across 24 countries, names insufficient worker skills as the single biggest barrier to integrating AI into existing workflows — ahead of budget, ahead of data readiness, ahead of security concerns. Yet 84 percent of organizations in the same survey haven't redesigned a single job or workflow around AI capabilities. Those two facts sitting next to each other describe most companies' current state exactly: leaders already suspect their people aren't skilled enough, and almost none of them have changed how work gets structured or verified in response.
That suspicion is well-founded. Workforce research covered in our piece on the vibe coding tax puts the number of enterprise employees with genuinely critical AI-agent skills as low as 13 percent, and finds that only 11 percent of employees can accurately self-assess their own AI competency in either direction. Asking a team whether they're comfortable with a tool, the way most companies currently do it, produces answers with almost no correlation to whether they actually are.
Why nobody just measures proficiency directly
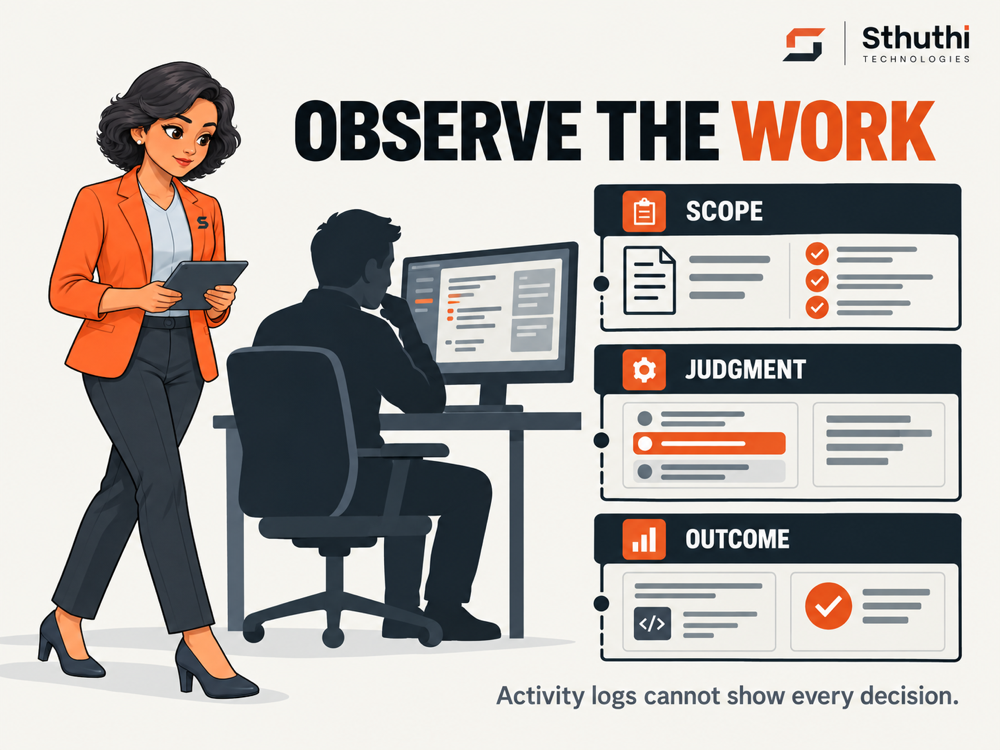
It isn't that engineering and L&D leaders don't want better data — it's that adoption metrics are what the vendor tooling exports by default, and proficiency isn't something a login event or a token count can capture. Telling a good AI-assisted diff from a plausible but wrong one, knowing when a task is a bad fit for the tool at all, catching scope creep in an agent-authored pull request before it merges — none of that shows up in an API log. It only shows up when someone is actually put in front of a real task and watched. That's an assessment design problem, not a data problem, which is why fixing it takes more than adding another chart to the Viva or Copilot dashboard.
What to test instead of what to log
A usage number can tell you a tool is switched on. It can't tell you whether the person using it would catch a scope-creeping diff, know when to take the keyboard back, or use their remaining judgment instead of the model's confidence. Closing that gap means replacing the adoption dashboard — not deleting it, but no longer treating it as the finish line — with a real, proctored, task-based check: put someone in front of the actual tool, on a task like the ones they'll run in production, and see whether their review habits hold up. That proctored-assessment model is the basis for every track we run, listed at our certifications page, and if the tool or workflow you need checked isn't one of the published tracks, talk to us about building a custom assessment around it.
For a worked example of how to pilot this, read should companies certify their Claude Code teams.
For a practical measurement setup, see how to measure Claude Code impact. To measure proficiency rather than usage, see how an AI skills assessment for employees works.
Frequently asked questions
What's the difference between AI adoption and AI proficiency?
Adoption measures whether someone used the tool at all — a login, a prompt sent, a suggestion accepted. Proficiency measures whether they used it well — whether they'd catch a bad diff, know when a task is a poor fit for AI, or avoid shipping a plausible-looking mistake. A dashboard can show 100% adoption and zero proficiency data.
Do GitHub Copilot's or Microsoft Viva's dashboards measure skill or just usage?
Just usage. GitHub's Copilot Metrics API tracks active users, acceptance rate, and PR throughput; Microsoft Viva Insights tracks "intentional actions" and adoption rate by team. Neither evaluates code quality, review judgment, or competency — both vendors' own documentation scopes them to activity volume, not skill.
Want your team's AI-tool usage actually checked?
See the published certification tracks, or tell us about the tool you're worried about.